Seal of Approval: Deciphering Third-Party Certifications
Consumer interest has expanded in recent years to include impact as well as ingredients. From just the nutrition panel to the perception of what the brand stands for, a concept we now refer to as “transparency,” is revolutionizing food production.
As one of the key motivators to put an item in the cart, a brand’s story also resonates with consumers’ desire for connectedness, authenticity and control of their world.
What does this mean for brands and retailers? To sell products, what’s in the (figurative) box matters as much as what behind it.
The tricky part: how do you get the right information about a brand’s farming practices, production processes, or whether the company itself practices sustainable measures to reduce their environmental impact to resonate with time-starved consumers? The answer: third-party certifications.
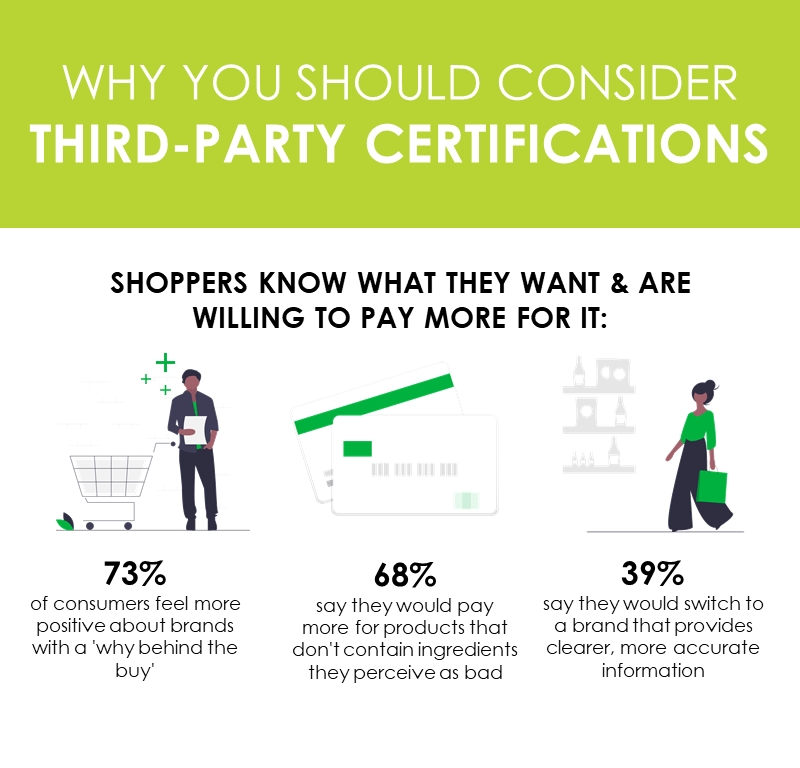
By offering a documented system of transparency, that often use public comment or consultation to shape standards, stores add legitimacy to company efforts and label claims. How can you do that? Here’s our rundown:
USDA Organic Seal
The USDA Organic seal is one of the most highly trusted certifications, with 75% of U.S. families noting their trust in the green USDA organic seal. But many shoppers are confused about what the seal really means.
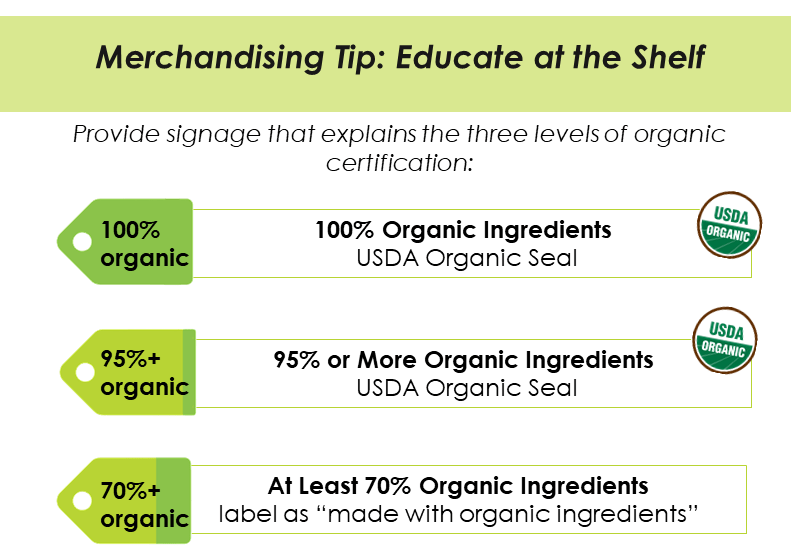
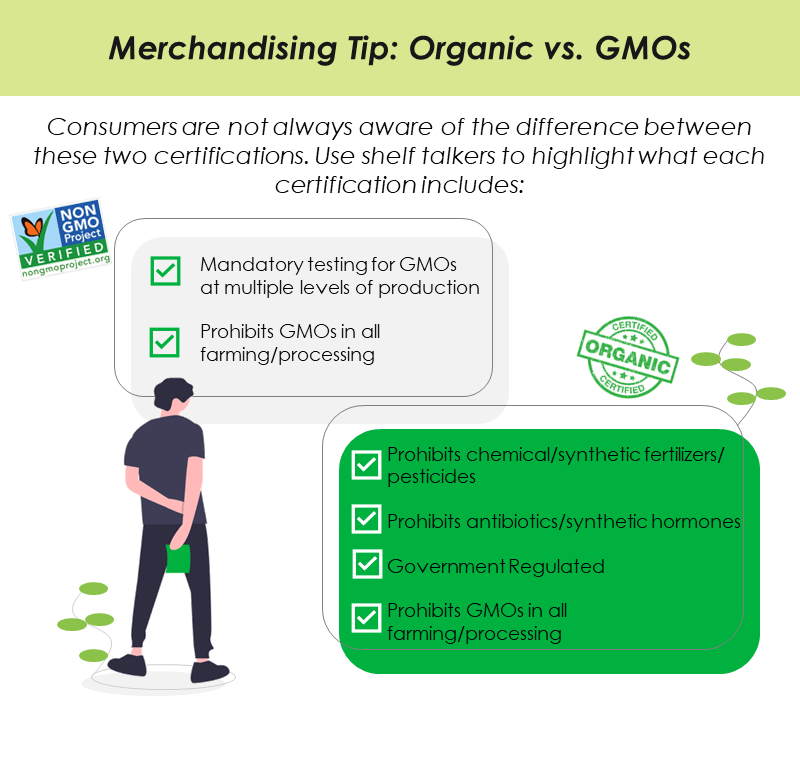
What is it: It’s an agricultural standard that includes how crops are grown and processed as well as how animals are raised. From production, processing, distribution and sales requirements, it ensures that products maintain organic integrity from farm to shelf.
For example, organic farmers must rely on practices like mulches, cover crops, crop rotations and dense planting as opposed to using toxic pesticides, herbicides and synthetic nitrogen fertilizers to enrich the soil.
How does a product earn the certification? To carry the green USDA organic seal, products must contain at least 95% organically grown ingredients, while products that contain 70%+ organic ingredients can only be labeled as “made with organic ingredients.”
The Impact Americans spend $50 billion annually on organic products with 82% of households saying they purchase organic and 75% of all product categories now providing organic options, according to data from the Organic Trade Association.
While produce is the largest organic product category, organic is now the fastest-growing segment in many product categories, including refrigerated juices and functional beverages (+12%), bread and baked goods (+12%), baby food (+13%), and wellness bars and gels (+22%).
Non-GMO Project Verified Certification
What is it? A market-based, voluntary strategy for preserving and building non-GMO ingredients and foods in North America. The product must be void of GMOs, which are genetically modified organisms in plants or animals that have been genetically engineered in a lab with DNA from other plants, animals, bacteria and viruses to make a plant resistant to a herbicide or so that it contains built-in pesticides.
How does a product earn it? The product must complete a comprehensive, third-party verification for compliance with the Non-GMO Project Standard. The process is rigorous and time consuming, taking on average between three and six months. It also requires ongoing audits from approved Technical Administrators.
The Impact: U.S. consumers (nine in 10) have consistently indicated that they believe the foods should be labeled accordingly.2Non-GMO Project Verified products now represent more than $26 billion in U.S. annual sales and the butterfly label used by more than 50,000 products and 3,000 brands.3b The certification is one of the fastest growing in the marketplace with good reason. Many consumers do not like GMOs in their foods.
- 70% say they avoid GMO foods for health and well-being.
- 36% of consumers say they are buying more non-GMO product than last year (55% buy the same amount).
- 46% of consumers say they are avoiding GMO foods, a 13% increase since 2014.
Source: The Hartman Group Organic and Natural 2018
Fair Trade Certification
What is it? Fair Trade is an ethical certification system designed to promote equality and sustainability in farming. The Fair Trade Certified seal continues to be important for consumers, generating awareness among 63% of consumers and purchase intent for one in three shoppers.5
How does a product earn it? Fair Trade certification covers such products as beans and grains, cocoa, coffee and tea, and fruits and vegetables. The program creates and implements standards, certifies and supports producers and supplier partners, engages businesses and consumers to drive demand, and measures impact of the programs.
The Impact: In 2017, fair trade products topped $1 billion in sales in the United States alone, and more than $9 billion worldwide, according to data from Fair Trade America,4 showing most prevalence in categories like shelf stable candy and shelf stable tea and coffee RTD. Shelf stable chips pretzels and snacks have seen the most growth in the last year, increasing 44% since February 2018.7
Merchandising Tips: Target Millennials Millennial shoppers are especially interested in products that back up claims to social and environmental responsibility. The more they know about the company and mission behind the certification, the more interested they’ll be.
Call out Fair Trade Certified suppliers and share their specific stories on environmental milestones, social justice, or giving back to communities.
References.
- The Nielsen Company. Its Clear Transparency is winning in the US market. 2017. https://www.nielsen.com/us/en/insights/reports/2017/transparency-is-winning-the-us-retail-market.html
- Where GMOs Hide in our Food. Consumer Report 2014. https://www.consumerreports.org/cro/2014/10/where-gmos-hide-in-your-food/index.htm
- Non-GMO Project Verified FAQs. https://www.nongmoproject.org/product-verification/verification-faqs/
- FairTrade tops $9 billion in global sales for first time on 8% growth. Oct. 2018. https://fairtradeamerica.org/Media-Center/Blog/2018/October/Fairtrade-tops-9-billion-in-global-sales
- NMI Consumer Research. 02/2018
- NMI Consumer Research. 02/2018
- IRI/SPINS MULO TTL US All Regions Frozen, Grocery, Refrigerated and Produce. L52 Weeks ending 2/24/19.